


The Inverse Head and Shoulders (“Golden Triangle”) pattern, a staple in the world of technical analysis, is a chart pattern used by traders to predict the reversal of a downward trend in a security’s price. It is essentially the bullish counterpart to the bearish head and shoulders pattern and serves as a reliable indicator for a potential shift from a bearish to a bullish market sentiment. This pattern is particularly relevant in stock, forex, and cryptocurrency markets.
Structure of the Inverse Head and Shoulders Pattern
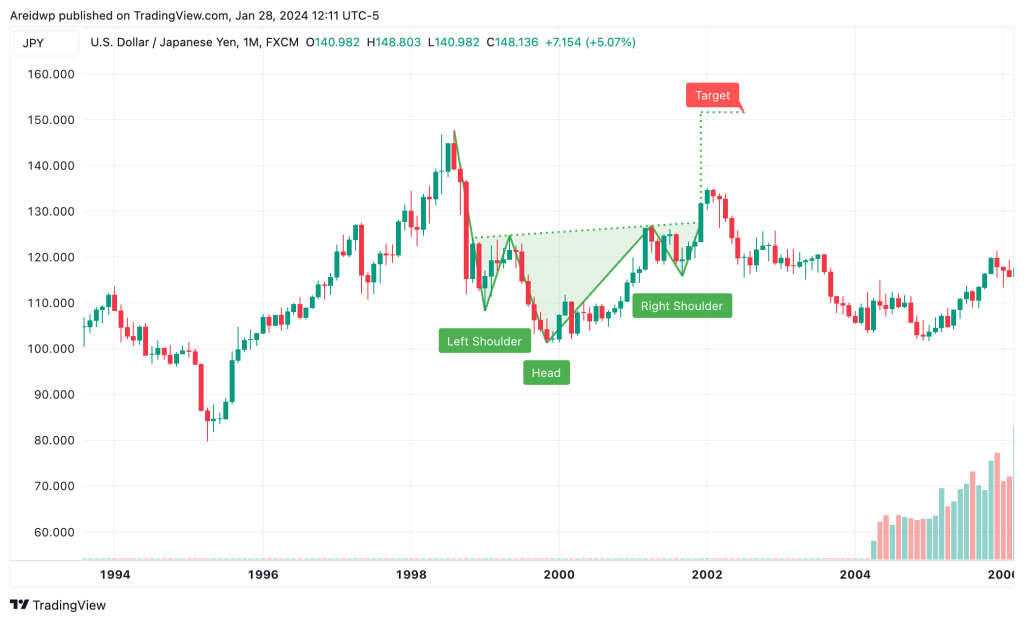
The inverse head and shoulders pattern is characterized by three troughs, with the middle trough (the head) being the deepest and the two outside troughs (the shoulders) being shallower and roughly equal in depth. These troughs are separated by two peaks, which create a neckline. The completion of this pattern is signaled when the price of the security breaks through this neckline, suggesting a potential bullish trend.
Interpreting the Inverse Head and Shoulders Pattern
- Formation: The pattern begins during a downtrend. The first trough forms as prices reach a new low and then rise to a peak (forming the left shoulder). The price then falls again to form a lower trough (the head), followed by a rise to a peak similar in height to the first. Finally, a third trough forms (the right shoulder), roughly equal in depth to the first, but does not descend as low as the head.
- Neckline: The peaks of the recoveries between the troughs form the neckline. This neckline can be horizontal or slope up or down and is crucial in determining the pattern’s reliability and the potential bullish reversal.
- Breakout: The completion and confirmation of the inverse head and shoulders pattern occur when the price breaks through the neckline with significant volume. This breakout indicates a potential reversal from a bearish to a bullish trend.
Win Rate and Reliability
Statistically, the win rate of the inverse head and shoulders pattern is the highest of all the chart patterns at 83.44%. Of course, the probability of a successful outcome following the pattern, varies based on the market and specific conditions. Generally, the inverse head and shoulders pattern is considered to be a more reliable bullish signal when accompanied by high trading volume, especially during the breakout.
Timing Entry and Exits
- Entry: A common strategy is to enter a long position (buy) once the price breaks above the neckline. Some traders wait for a retest of the neckline after the initial breakout to confirm the reversal.
- Stop Loss: To manage risk, a stop loss is often placed just below the right shoulder or the head, depending on the trader’s risk tolerance.
- Profit Targets: The profit target is typically set by measuring the vertical distance from the head to the neckline and projecting that distance upward from the breakout point.
- Exit: An exit strategy might involve closing the position once the price reaches the profit target or if there are signs of a trend reversal.
In conclusion, the inverse head and shoulders pattern is a valuable tool for traders, offering insights into potential trend reversals. However, it should be used in conjunction with other indicators and sound risk management strategies to enhance its effectiveness and manage potential risks.