


What is the millionaire trading pattern? It’s commonly called a “Bull Flag Pattern” and its one of the most highly regarded chart patterns in the world of trading, revered for its predictive quality in indicating a continuation of an upward trend in the price of a security, commodity, or index. This report aims to delineate the essence of the Bull Flag pattern, its usefulness, reasons for its impressive success rate, and the key metrics that define this pattern.
What is a Bull Flag Pattern?
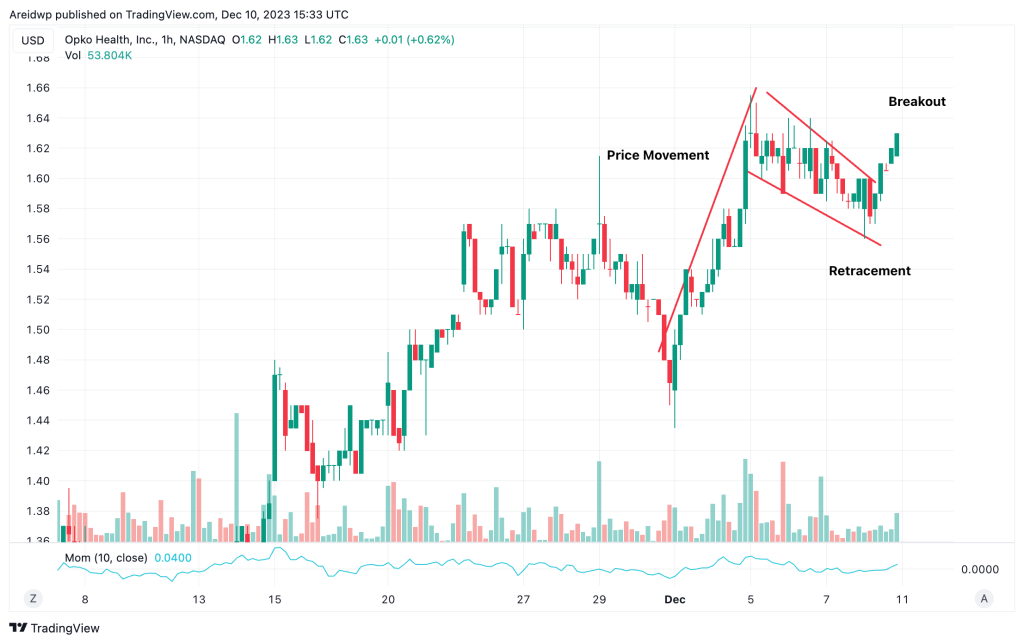
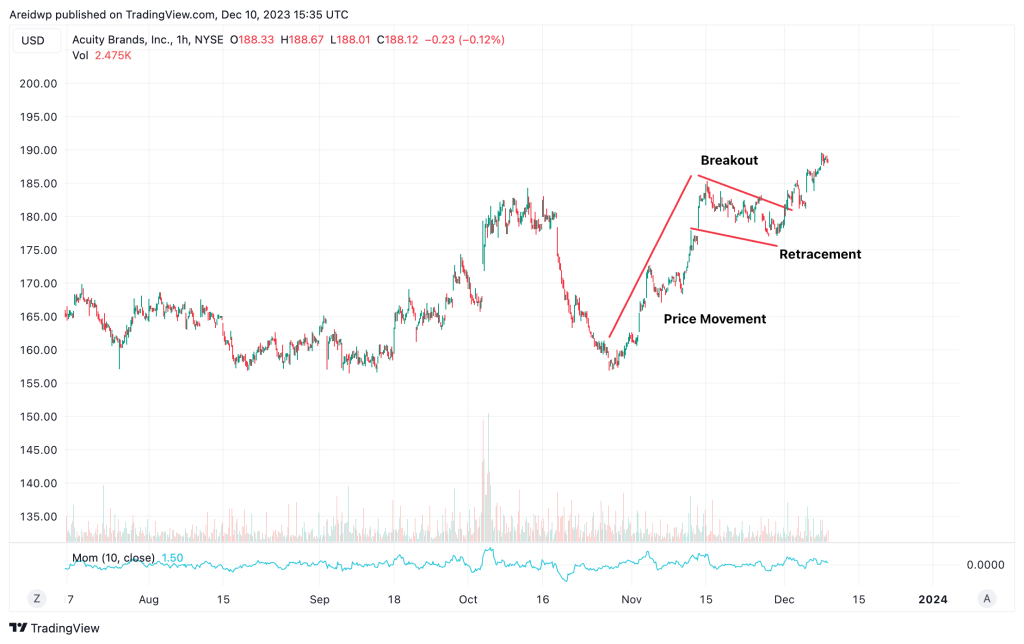
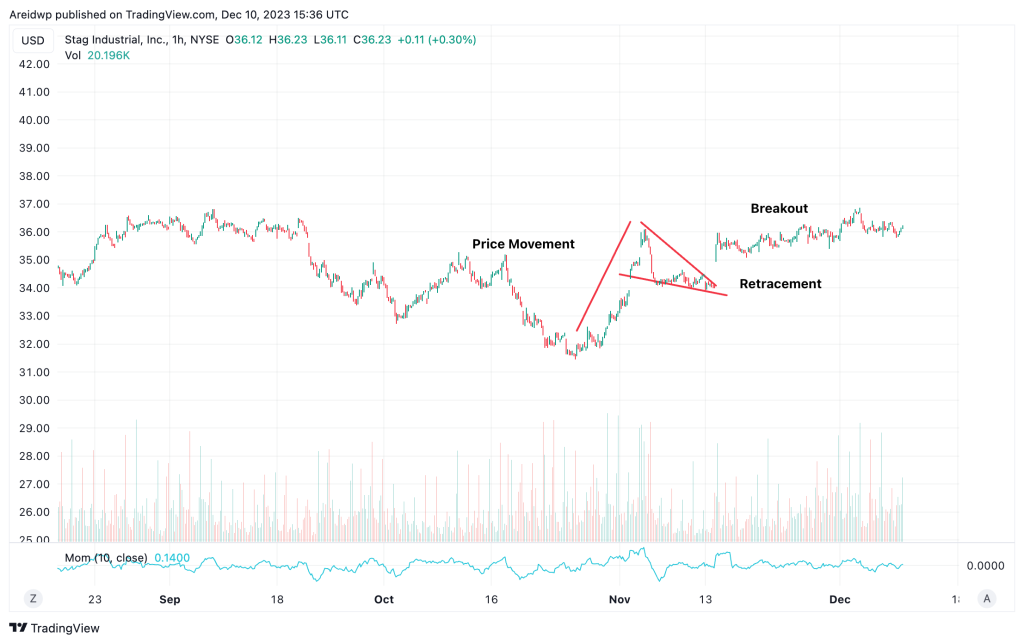
A Bull Flag pattern is a chart formation that appears when a stock (or any other traded instrument) experiences a strong upward movement in price, followed by a consolidation phase, and then continues its upward trajectory. This pattern is so named because it resembles a flag on a pole; the pole is formed by the initial price surge, and the flag is represented by the consolidation phase.
Characteristics of the Bull Flag Pattern:
- Pole Creation: The formation begins with a sharp, almost vertical price increase, which forms the ‘pole’ of the flag.
- Flag Formation: Following the pole, there is a downward sloping price consolidation, creating a rectangular or parallelogram shape. This ‘flag’ typically contains minor price fluctuations.
- Breakout: The completion of the pattern is marked by a breakout, where the price exits the flag structure, usually in the same direction as the initial surge, continuing the bullish trend.
Why is it Useful?
The Bull Flag pattern is especially useful for traders for several reasons:
- Predictability: It reliably indicates the continuation of an existing upward trend, allowing traders to make more informed decisions.
- Entry Points: The pattern provides clear entry and exit points. Traders often enter a position when the price breaks above the upper boundary of the flag.
- Risk Management: The defined structure of the flag allows for clear stop-loss points, minimizing potential losses.
High Success Rate
The Bull Flag pattern boasts a high success rate (historically 85%) due to:
- Market Psychology: It reflects a pause in the market after a strong move, suggesting that the initial bullish sentiment remains intact.
- Volume Analysis: Typically, volume is higher during the pole formation and lower during the flag formation, followed by an increase at the breakout point, confirming the pattern’s strength.
- Self-fulfilling Prophecy: Its popularity among traders means that many are watching for these patterns and acting in ways that reinforce the trend.
Key Metrics for a Bull Flag Pattern
To accurately identify a Bull Flag pattern, traders should consider the following metrics:
- Pole Height: The initial surge (pole) should be significant and on high volume.
- Flag Duration: Ideally, the flag should form over a short period, ranging from a few days to a few weeks.
- Volume Patterns: Volume should decrease during the formation of the flag and increase on the breakout.
- Breakout Confirmation: The price should break above the upper boundary of the flag on higher volume to confirm the continuation of the trend.
- Target Projection: The target after the breakout is often projected to be equal to the height of the pole added to the breakout level.
In conclusion, the Bull Flag pattern is a powerful tool in a trader’s arsenal, offering insights into market trends, providing clear trading signals, and aiding in effective risk management. Its recognition and understanding are crucial for new traders aiming to capitalize on bullish market trends.